Loop Analyst
Documentation of Software for Qualitative Loop Analysis
Introduction
Interface
Tutorial
The Program Menu
The File Menu
The Edit Menu
The Analysis Menu
References
CAVEAT: Loop Analyst is a work in progress. The GUI version may be slightly buggy in the user interface, and there are scads of functionalities still left to implement, but it's quite usable at present. So use at your own risk. I would love your insight.
Loop Analysis
The core of the method involves the representation of a system in both a graphical form using signed digraphs, and in matrix form using square (–1, 0, 1) matrices. These representations are used to qualitative describe direct causal effects (including self-effects) between the component variables of the system as increases, decreases, or has no effect, under and assumption that the turnover of each variable is within approximately an order of magnitude. The community effect formula below is then applied to create a table of predictions of the indirect effect on each variable given a positive signal to any particular variable.
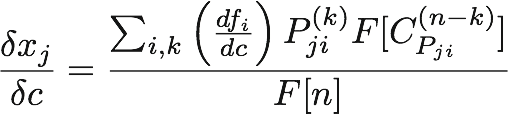
where:
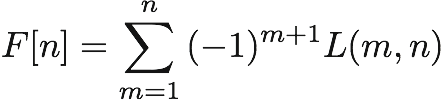
for L(m,n) = m disjoint loops (simple cycles) spanning exactly n variables.
Contact
I am happy to take feedback, respond to requests for assistance, and consider feature requests. I can be contacted at:
Installation
Unzip the Loop Analyst.zip archive, and move the Loop Analyst folder to your hard drive. Double-click on the program icon to launch the program.
If you would like to use Loop Analyst's graphing capabilities, you will need to have a working copy of graphviz installed on your system. This can be done using MacPorts, although Ryan Schmidt makes a very nice pre-built version available for free download. If Loop Analyst does not find your version of graphviz’s dot command by itself, you can enter the pathway in Preferences.
Loop Analyst is distributed under the terms of the GPL version 2 or higher.
Validity
Loop Analyst was validated against loop analyses in numerous published studies (you can examine some in the Published.cml document). The weighted feedback functions have been validated against results from the analysis of 30 randomly-generated community matrices (five in each size category ranging from three variables to eight variables) with moderate connectance using Jeffrey Dambacher's software for Maple in Revision 2 of Ecological Archives E083–022-S1, Supplement 1 to Ecology 83:1372–1385. The results matched exactly. Here are the 30 matrices in Rdata format, and the results from the analysis using Dambacher's software in pdf.
The interface of Loop Analyst is straightforward. The left side of the program window lists the loop models in the currently loaded library of loop models. This list is blank when starting the program. Above the library list are three buttons used, as labeled, to add a new community matrix, or edit or delete the currently selected community matrix. To the right, occupying most of the program window, is the output area. The output area has tabs along the top which permit the user to select a particular aspect of the analysis to present.
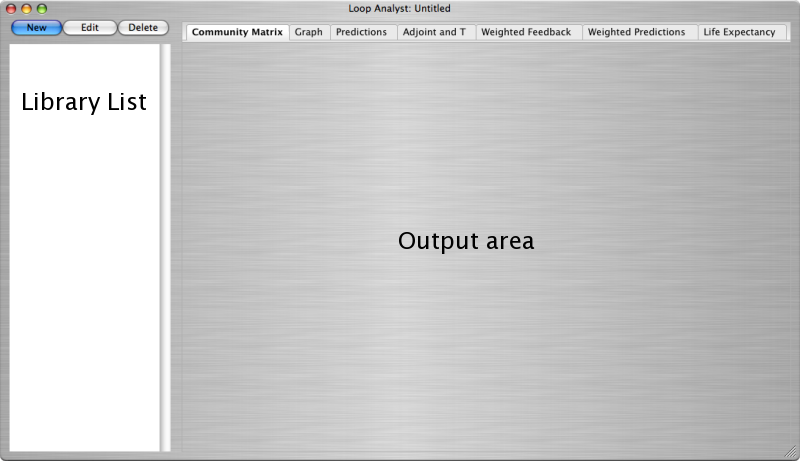
 The commands are all accessed through the menus, with appropriate keyboard shortcuts listed in each menu. One may also edit a specific community matrix by double-clicking on it. Clicking on each tab at the top of the output area brings the appropriate page to the front. The up and down arrow keys can be used to move through the list of community matrices, and the output area will change accordingly.
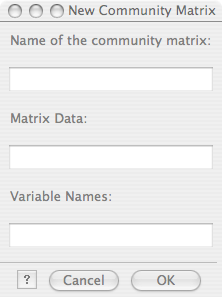
This image to the right shows the new community matrix/edit a community matrix interface. Each system can be given a name in the top row, data defining the system are entered in the middle row, and (optionally) the system variables are named in the bottom row. Details about the format used for entering the data and the variable names are found in the New CM portion of the File Menu section below.
This is a basic tutorial intended to introduce you to the use of Loop Analyst. It covers the creation of a new community matrix and describes the components of the analyses, editing a community matrix, and building a library of community matrices. This tutorial is not intended to substantively introduce the method of loop analysis, how it is used, or the assumptions upon which its validity is contingent. I assume that you are familiar with the most basic loop analysis terminology (e.g. "self-effect," "loop," "path," etc.).
Creating a new community matrix
Start Loop Analyst and click on the "New" button in the top left of the screen. (You can also select "New CM" from the file menu, or by typing <COMMAND>-N) This should open the new community matrix dialog, which has three entry fields: one for the name of the matrix, one for the data in the matrix, and one for the names of the variables in the matrix. Go ahead and type a name in the top field, perhaps "My Fabulous Loop Model".
Now let's put some data in the matrix. We'll start with one of the simplest possible systems by reproducing the one used in the Loop Analyst logo. This is a system of two variables, A and B. A has a negative self-effect (i.e. is self-damping), and a positive direct effect on B. B has a negative direct effect on A. A detailed description of the constraints of the data in a community matrix is given in the File Menu section. For now we'll note that the data should be represented in a nested list format using square brackets like this: [[-1,-1],[1,0]]. The first list is [-1,-1] and qualitatively represents the direct effects of all variable in the system on the first variable, which is A. In plain language "A is qualitatively a function of negative A, and negative B." The second list [1,0] represents the direct effects of all the variables in the system on B. Note that the number of lists and the number of elements in each list must be exactly the same, and must equal the number of variables in the system.
Let's leave the variable names blank for now, and just click the "OK" button (or type return). Back on the main screen Loop Analyst, if everything was entered correctly should now display:
A BCommunity Matrix
My Fabulous Loop Model
A - -
B + 0
(If you got an error message, just go back and try again) Notice that Loop Analyst chose the default names A and B for the variables.
If you have graphviz installed, and there is a valid path to it's dot command in Preferences, when you click on the "Graph" tab at the top of the window, you should see a picture that looks similar to the Loop Analyst logo. It may be in color, where the node representing each variable and the paths emanating directly from it are colored uniquely. This coloration method can make large systems and highly connected systems easier to read (see, for example, the graph for the community matrix "Fig 6 Dambacher 2002 Ecology 83(5)" in the library Published.cml provided with this software). You can change the coloration of graphs in Preferences.
Now click on the "Predictions" tab at the top of the window. You should see:
A B
Prediction Matrix
My Fabulous Loop Model
A 0 +
B - +
This is the prediction matrix (also called the "table of predictions", and the "community effect matrix" in the literature). Each element aij represents the predicted direction of change in the value of variable j, given a steady positive input at variable i, where i is the row, and j is the column. The values of these elements may be positive "+", no effect "0", negative "–", or ambiguous "?". (Ambiguous results have sometimes been represented by "+/–" in the published literature.)
The remaining tabs provide various extensions to the classical loop analysis given in the first three tabs. Following Dambacher et al., (2003), the Adjoint and T matrices represent the net feedback and total feedback respectively. The weighted feedback matrix is equal to the element-wise absolute value of the Adjoint divided by the value of the corresponding value of T. The weighted predictions matrix applies a decision criterion (default is weighted feedback >= .5) to ambiguous predictions in the predictions matrix to estimate the likely direction of change. Recent work extending loop analysis Dambacher et al., (2005) permit qualitative change in life expectancy predictions, which are found under the "Life Expectancy" tab.
Editing a community matrix Click on the "Edit" button to pop up the Edit the Community Matrix window. Go ahead and change the name of variable A to "plants", and variable B to "herbivores". Click OK, and look at the graph and matrix output to see the changes reflected there.
Building a library of community matrices
We can add additional matrices by clicking on the "New" button, as described above. We can also cut and paste existing matrices using the commands in the Edit Menu. In the Library List, click on the matrix you made above, and select "Duplicate" from the Edit Menu. Now edit this matrix, by changing the data to [[-1,-1,0],[1,0,-1],[0,1,0]], adding a third name "predators", and clicking the "OK" button. Examine the output, and use the up and down arrows to move between different matrices. You can save and reopen your library as a .cml document.
About and Quit
These behave as you would expect.
Preferences
Users can customize the way Loop Analyst works, for example:
- rendering graphs in color, greyscale, or black and white
- specifying the path to the graphviz dot command in order to enable graphing of the community matrix
- choosing the precision presented in weighted feedback matrices
- setting the size of the font used to display the analyses in the output panel
- setting the threshold for deciding to disambiguate a prediction using weighted feedback, and setting whether that decision is based on values that are strictly greater than, or greater than or equal to the threshold. The default value is >= .5
Undo/Redo
Undo and Redo step through the edit history of the library since it was opened, reverted, or created.
New CM
New CM pops up a dialog which requests the optional name of the new community matrix, the data describing it, and the optional names of the system variables. A community matrix specified without a name will be named "Matrix" by default. If no variable names are specified the letters of the alphabet will automatically be used to label the variables.
The data describing a community matrix are entered as follows:
- The data are formatted with an outer pair of square brackets:
[…] - Each row of data is represented by pair of square brackets, sepparated by commas:
[ […],[…],[…] ] - Each qualitatively specified effect on a variable is comma sepparated within the brackets corresponding to that variable's row:
[ [-1,-1,0],[1,0,-1],[0,1,0] ] - A community matrix must be square (i.e. have the same number of columns and rows).
- There must be at least one direct or indirect path leading from each variable in the system to every variable in the system.
- At least one variable must have a self-effect (i.e. the must be at least one non-zero value on the diagonal).
- All matrix values must be
-1,0or1.
The names of the variables in a community matrix are entered as follows:
- Each name should be delimited by single quotes, such as
'H'. - Names should be separated by commas, and the set of names should be delimited by square brackets in this manner:
['R','H','x','y'] - If you leave the bottom row empty, Loop Analyst will name each variable with a consecutive letter of the alphabet.
- If you would like to have line breaks between terms in your variable name use the backslash and lower case
ncharacters\n, for example'My\nVariable'. This will render variable labels over two or more lines in the graph, although the name will be rendered on one line in the various tables (with spaces, in place of line breaks).
Loop Anlayst will automatically calculate font size adjustments so that names fit within the circle representing each variable in the graph.
New Library
Be sure you have saved your previous work, as New Library does not make a backup before clearing existing community matrices and analyses.
Append
Append loads the community matrices from a saved community matrix library (.cml) document that you select. The names of the appended community matrices are not adjusted, and may duplicate community matrices in the already open library.
Save
Saves changes to the currently opened community matrix library. If you try to Save a previously unsaved community matrix library a file dialog will appear for you to name the document, and indicate where on your system you would like to save it.
Save As
Save As will make a file dialog appear for you to name the document, and indicate where on your system you would like to save it.
Save Graph
Save Graph saves the currenxitly selected community matrix's graph decription in png file format (.png) to a location in your system that you specify through the pop-up dialog.
Export Analyses
Export analyses saves the output from the Community Matrix, Predictions, Adjoint and T, Weighted Feedback, Weighted Predictions, and Life Expectancy tabs for the currently selected community matrix to a document you specify through the pop-up dialog in plain text format.
Export Graph
Export Graph saves the currently selected community matrix's graph decription in dot file format (.dot) to a location in your system that you specify through the pop-up dialog. This document is a description of a graph (useable, for example, with graphviz), not the actual visual representation of the graph (which you can get using Save Graph under the File menu, or Copy Graph under the Edit menu).
Revert to Saved
Reverts to the last saved version of the open community matrix library. All changes made after the last save are lost.
Cut
Copies the currently selected community matrix to Loop Analyst's clipboard, and removes it from the library.
Copy
Copies the currently selected community matrix to Loop Analyst's clipboard.
Paste
Pastes a copied community matrix into the library just after the currently selected community matrix.
Delete
Deletes the currently selected community matrix from the library.
Duplicate
Makes a duplicate of the currently selected community matrix and puts the duplicate immediately after it.
Edit
Opens a dialog that permits the editing of the currentlyt selected community matrix's name, data, or variable names.
Copy Community Matrix
Copies the currently selected community matrix as represented on the Community Matrix tab to the clipboard for pasting into other programs.
Copy Graph
Copies the image appearing on the Graph tab for the currently selected community matrix (png file format) to the clipboard for pasting into other programs.
Copy Predictions
Copies the table of predictions (community effect matrix) for the currently selected communityt matrix to the clipboard for pasting into other programs.
Copy Adjoint and T Matrices
Copies the Adjoint of the negative of the current community matrix and the total feedback matrix to the clipboard for pasting into other programs. NOTE: The adjoint and total feedback matrices are transposed by convention from the orientation of the prediction and community matrices.
Copy Weighted Feedback Matrix
Copies the weighted feedback matrix from the Weighted Feedback tab for the currently selected community matrix to the clipboard for pasting into other programs.
Copy Weighted Predictions Matrix
Copies the weighted prediction matrix from the Weighted Predictions tab for the currently selected community matrix to the clipboard for pasting into other programs.
Copy Change in Life Expectancy Matrix
Copies the predicted change in life expectancy matrix for the currently selected community matrix to the clipboard for pasting into other programs.
Copy Entire Analysis
Copies the community matrix, table of predictions, adjoint and total feedback matrices, weighted feedback, weighted predictions, and change in life expectancy matrices for the currently selected community matrix to the clipboard for pasting into other programs.
The following references may serve to help ground one in the theory, mechanics and application of loop analysis. The text by Puccia and Levins is out of print, but can be special ordered from Harvard University Press. The paper by Justus gives an excellent overview of the method's limitations. Extensions to loop analysis using weighted feedback were developed by Dambacher, and he, Levins and Rossignol produced the life expectancy methods.
- C. J. Puccia and R. Levins. 1986. Qualitative Modeling of Complex Systems: An Introduction to Loop Analysis and Time Averaging. Harvard University Press, Cambridge, MA.
- R. Levins. 1974. "The qualitative analysis of partially specified systems." Annals of the New York Academy of Sciences, 231: 123–138.
- J. M. Dambacher, H.-K. Luh, H. W. Li, and P. A. Rossignol. 2003. Qualitative stability and ambiguity in model ecosystems. The American Naturalist, 161(6):876–888
- J. M. Dambacher, R. Levins, and P. A. Rossignol. 2005. "Life expectancy change in perturbed communities: Derivation and qualitative analysis." Mathematical Biosciences, 197:1–14.
- J. Justus. 2006. "Loop analysis and qualitative modeling: limitations and merits." Biology and Philosophy. 21:647–666.